

|
Initial time : NOW LOADING...
?
Observation: The direct observation of rain intensity by Saitama MP-PAWR. Areas where observations are unavailable due to shadow effects are masked.
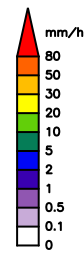
Analysis: The estimated rain intensity by the data asimilation incorporating the observation data to the numerical model. Both are shown in a unit of rain rate (mm/h) transformed from radar reflectivity (equivalent radar reflectivity factor) at 2 km height level. ?
The probability (%) of rain over 30 mm/h obtained from the ensemble forecast is displayed.
Auto update
Animate
|
View JMA warnings / advisories |
Map view
Displayed on the map is the observation or analysis of the previous 10 minutes and the forecast up to 30 minutes ahead.
Shaded areas are out-of-bound of the forecast region.
This forecast is open to the public during the experimental periods covering 13:00 JST 20 July 2021 to 8 August 2021, and 13:00 JST 24 August to 5 September 2021. Outside these periods, or when realtime data is temporarily unavaiable, the forecast area is hatched with "No forecast" sign.
Observation
The observed rain intensity by the Multi-Parameter Phased Array Weather Radar (MP-PAWR) is displayed. Hatched areas indicate regions where observations were unavailable due to shadow effects.
The rain intensity at 2 km height level is shown on the map. Light and heavy rain are indicated by blue and red shading, respectively.
Analysis
Estimated rain intensity given by the analysis following the asimilation of radar observations by the LETKF is displayed. The analysis provides a complete set of rain intensity values for the region, including in areas where observations may be missing. The rain intensity at 2 km height level is shown on the map in a similar way to observation.
Forecast (Rain intensity)
Rain intensity is predicted up to 30 minutes ahead, based on forecasts initialized from the analysis mean. The rain intensity at 2 km height level is shown on the map in a similar way to observation.
Forecast (Probability)
The probability of heavy rain over 30 mm/h based on the ensemble forecast initialized with the analysis ensemble set is displayed by shades in three colors. Areas shaded in yellow, red, purple indicate areas where the probability of heavy rain over 30 mm/h is greater than 30, 70, 90 %, respectively.
Please note that the definition of "probability of heavy rain" is different from "probability of precipitation" used by JMA.
Methodology
Observation : Phased Array Weather Radar
The observation data used in this forecast is provided by Multi-Parameter Phased Array Weather Radar(MP-PAWR) at Saitama University, developed by a research group lead by National Institute of Information and Communications Technology (NICT) in the Cross-ministerial Strategic Innovation Promotion Program(SIP) "Enhancement of Social Resiliency against Natural Disasters". The MP-PAWR is the dual-polarized version of the Phased Array Weather Radar (PAWR), developed by Toshiba, the University of Osaka, and NICT. The MP-PAWR scans the three dimensional atmospheric volume every 30 seconds, which is about 10 times more frequent than normal operational weather radars.Data assimilation and forecast : SCALE-LETKF
The regional numerical weather forecast model SCALE-RM, which is a component of Scalable Computing for Advanced Library and Environment(SCALE) developed by RIKEN CCS Computational Climate Science Research Team, is used in this forecast.
The model calculates the time evolution of the grid point values of atmospheric variables such as wind, temperature, humidity, cloud, rain and snow. The domain is 128 km square centering the radar location in Saitama prefecture. Grid size is 500m in the horizontal and ranges between 100-800m in the vertical.
The SCALE-LETKF combines the SCALE-RM with the Local Ensemble Transformed Kalman Filter (LETKF) data assimilation algorithm and has been developed by Data Assimilation Research Team for research purposes, including the forecasts presented here. The SCALE-LETKF assimilates both radar reflectivity (rain intensity) and Doppler velocity (movement of rain particles) observed by the MP-PAWR every 30 seconds to provide up-to-the-minute analyses and 30-minute extended forecasts.
The 3-d nowcast also uses the same reflectivity observation. The difference is the forecast method. By explicitly calculating each atmospheric variable such as wind or temperature using the numerical weather forecast model based on the laws of physics, this forecast method has greater potential to reproduce complex physical processes. This should lead to better representation of rainfall in extended forecasts.
This forecast also provides probabilistic forecast products based on the ensemble forecast by the SCALE-LETKF. The single accurate forecast of an intense convective rain event is difficult as it evolves very rapidly. The probabilistic forecast can provide better information in such a situation. Although this approach is not yet operationally used in short-period precipitation forecast, it has been intensively studied as a possible form of weather forecasting in a near future.
Computation on Supercomputer Fugaku
Data assimilation with the LETKF is typically performed with ensemble sizes ranging between 10 to 100 members. Large ensemble sizes enable improved representation of error covariances used by LETKF. Due to the high computational expense, data assimilation is typically performed using limited ensemble sizes. However, the massive computational resources provided by the world's most powerful supercomputer, the Supercomputer Fugaku(RIKEN CCS, allow for extremely large ensemble sizes to be used. During the experimental forecast periods, the realtime SCALE-LETKF system will use an ensemble size of 1000 members, using approximately 11,000 nodes (approximately 9 % of Fugaku's total power). This will represent the first ever real-time forecast performed with such large ensemble size.
Disclaimer
Copyright
All texts, photographs, diagrams, and other materials on this website are copyrighted by RIKEN unless explicitly specified otherwise on the website. It is prohibited to use, reproduce, or modify any of the material without RIKEN's permission.
References
- Amemiya, A., T. Honda and T. Miyoshi, 2020: Improving the Observation Operator for the Phased Array Weather Radar in the SCALE-LETKF system, SOLA, 16, 6-11. doi:10.2151/sola.2020-002
- Maejima, Y., M. Kunii and T. Miyoshi, 2017: 30-second-Update 100-m-Mesh Data Assimilation Experiments: A Sudden Local Rain Case in Kobe on 11 September 2014, SOLA, 13, 174-180. doi:10.2151/sola.2017-032
- Lien, G.-Y., T. Miyoshi, S. Nishizawa, R. Yoshida, H. Yashiro, S. A. Adachi, T. Yamaura, and H. Tomita, 2017: The near-real-time SCALE-LETKF system: A case of the September 2015 Kanto-Tohoku heavy rainfall. SOLA, 13, 1–6. doi:10.2151/sola.2017-001
- Miyoshi, T., G.-Y. Lien, S. Satoh, T. Ushio, K. Bessho, H. Tomita, S. Nishizawa, R. Yoshida, S.A. Adachi, J. Liao, B. Gerofi, Y. Ishikawa, M. Kunii, J. J. Ruiz, Y. Maejima, S. Otsuka, M. Otsuka, K. Okamoto, and H. Seko, 2016: "Big Data Assimilation" Toward Post-Petascale Severe Weather Prediction: An Overview and Progress. Proceedings of the IEEE, vol. 104, no. 11, pp. 2155-2179. doi: 10.1109/JPROC.2016.2602560
- Miyoshi, T., M. Kunii, J. J. Ruiz, G.-Y. Lien, S. Satoh, T. Ushio, K. Bessho, H. Seko, H. Tomita, and Y. Ishikawa, 2016: "Big Data Assimilation" Revolutionizing Severe Weather Prediction. Bull. Amer. Meteor. Soc., 97, 1347–1354. doi: 10.1175/BAMS-D-15-00144.1
